Introduction
TikTok is a popular social media platform that allows users to create and share short videos. The platform has gained popularity among young people and has become a significant source of news and information. However, there is limited research on the political content on TikTok and how the platform’s algorithms may influence the spread of political content. This project aims to analyze the political content on TikTok and investigate whether the platform contains biased political leaning content. The project will also explore how the TikTok community reacts to different political leaning content and whether different political leaning videos have different lexical diversity. The project will use a public multimodal dataset of TikTok videos related to the 2024 US presidential election to conduct the analysis. The dataset contains video IDs, author IDs, author followers, heart counts, comments, and transcripts. The project will use sentiment analysis, emotion analysis, and political bias analysis models to analyze the data. The project will also use lexical diversity analysis to analyze the transcripts of the videos. The project will provide insights into the political content on TikTok and how the platform’s algorithms may influence the spread of political content.
In particular, I am interested in the following research questions:
- RQ1: Does the platform contain biased political leaning content on each day?
- RQ2: Which engagement factor influences the possibility of a video being viewed?
- RQ3: Does the TikTok community react to different political leaning content equally?
- RQ4: Whether different political leaning videos on TikTok have different lexical diversity?
- RQ5: To what extent do videos with different political leanings cover the same categories?
Contributions: This work found that the platform contains biased political leaning content, with right-leaning videos being the most prevalent. This work also found that the TikTok community reacts differently to content with different political leanings, with varying levels of positive sentiment and joy emotion comments. The analysis also shows that center videos have a higher lexical diversity than left and right videos. The findings provide insights into the political content on TikTok and how the platform’s algorithms may influence the spread of political content.
Related work
Several studies provide a foundation for analyzing political content on TikTok. TikTok’s Role in Political Communication explores TikTok’s evolution as a platform for political discourse, focusing on its unique features like the For You algorithm and duet functionality. TikTok and Black Political Consumerism investigates how TikTok influences political activism among Black users through information gathering. TikTok’s Influence on Generation Z’s Political Behavior examines TikTok’s impact on young citizens’ political attitudes during elections. The Impact of TikTok’s Engagement Algorithm on Political Polarization analyzes how algorithms may contribute to political polarization. How Algorithms Shape the Distribution of Political Advertising studies algorithmic influence on political ad distribution. #TulsaFlop: A Case Study of Algorithmically-Influenced Collective Action on TikTok explores how TikTok algorithms amplified calls for collective action. Like, Comment, and Share on TikTok: Exploring the Effect of Viewer Engagement on News Content examines factors affecting audience engagement with news on TikTok. Finally, TikTok and Civic Activity among Young Adults investigates the connection between posting political videos and offline civic engagement.
While these studies explore TikTok’s role in political communication, user engagement, and algorithmic effects, our work differs by focusing specifically on the political content related to the 2024 US presidential election. We aim to analyze the potential biases in political leanings, the engagement factors influencing video viewership, the community’s reactions to content of varying political leanings, and the lexical diversity across political leaning videos.
Methods and data analysis
With the given video IDs from [2407.01471] Tracking the 2024 US Presidential Election Chatter on TikTok: A Public Multimodal Dataset (arxiv.org), the entire data processing and analysis run through the following steps. To speed up the process, all data collection and processing were done on four different machines with dedicated IPs and TikTok login credentials:
- Collecting Videos’ metadata
Limited by the TikTok research API’s application timeline, I could not use metadata_collection.py. Also, a simple fetch could be much more effective than pyktok, which uses a simulated browser environment to get data from a webpage. Additionally, the TikTokApi package has not been updated in recent months, while the TikTok API has been updated, which could prevent me from getting the most up-to-date data or lower the stability of my data collection step.
Due to the limited time given for this project, the data collection was done using a self-developed data collection script with a simple fetch and a self-deployed data fetching API server using Evil0ctal/Douyin_TikTok_Download_API, which had the highest number of stars on the day I started data collection. With those, the following data have been collected:
- Metadata: Data includes video ID, author ID, author followers, like counts. Data is collected by a simple fetch request to the TikTok webpage.
- Comments: Data includes comment text, comment time, and comment likes. Comments are collected by the third-party API server.
- Transcript: The transcript is collected by a simple fetch request to the download link obtained from the metadata.
- Preliminary analysis
Some of the research questions require the political leaning and sentiment or emotions of the video. Those data for each comment and transcript was computed by using the following models:
- Sentiment analysis with siebert/sentiment-roberta-large-english: A top-ranked sentiment analysis model trained on the English language. Data will be classified as positive or negative. A threshold of 0.5 is used to classify the sentiment.
- Emotion analysis with j-hartmann/emotion-english-distilroberta-base: A top-ranked emotion analysis model trained on the English language. Data will be classified as anger, disgust, fear, joy, neutral, sadness, or surprise. A threshold of 0.5 is used to classify the emotion.
- Political leaning analysis with bucketresearch/politicalBiasBERT: A top-ranked political bias analysis model trained on the English language. Data will be classified as left, right, or center. A threshold of 0.5 is used to classify the political bias. If no political bias is detected, the data will be classified as non-political.
- Lexical diversity analysis with LexicalRichness: The lexical diversity is calculated using the MATTR strategy, which utilizes the moving average type-token ratio. As recommended by the author, the window size of 25 is selected. Since most comments have a length of fewer than 25 words, the lexical diversity is only calculated for the video transcripts.
- Comments’ engagement: The comments’ engagement is calculated by summing the number of likes and replies to all comments. The comments’ engagement is only calculated for content with comments.
- Videos’ lifetime: The videos’ lifetime is calculated by the time from the first comment to the last comment. The videos’ lifetime is only calculated for content with comments.
Result
Limited by the time of this project, 198,239 IDs were randomly selected from the original dataset of 1,799,333 IDs from TikTok_IDs_Memo1.csv for data collection. Among those IDs, 29,282 were not available due to unknown reasons, most likely due to insufficient waiting time between fetch requests. Among the remaining IDs, 116,929 were available, while 52,028 were not available.
Among the 116,929 available IDs, there were 102,536 videos, 184 others, and 14,209 slides with images. Considering that people engage with images significantly differently than they do with videos, and TikTok may have different strategies for recommending videos and images, only videos were considered for this data analysis.
Out of the 102,536 videos, 27,286 have transcripts. The ratio of videos with transcripts is 26.6%, which is higher than the 14.7% suggested by the original dataset. During the data fetching process, 14 videos failed to fetch comments, 12 failed to fetch transcripts due to rate limits, and 1 failed to get transcripts because the transcript was in a malformatted webvtt format. Of the videos with transcripts, 13,254 are classified as non-political, while 14,032 are classified as political. Within the political videos, 5,181 are classified as left, 8,595 as right, and 256 as center.
Considering all models used are pre-trained on English content, research questions using data from those models are limited to videos with English transcripts only.
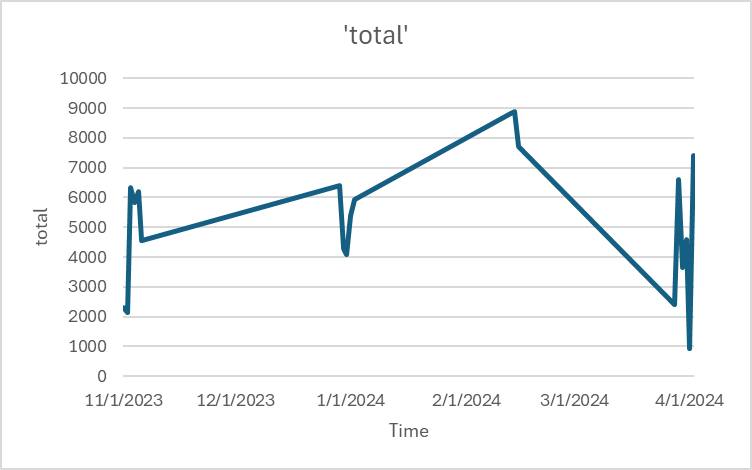
[The total available videos from each day. No data was collected between 11/8-12/27, 1/3-2/13, and 2/16-3/28. The image uses a single line to connect these gaps; the number of videos on the boundary dates has been excluded from the graph for better visualization.]
RQ1: Does the platform contains biased political leaning content on each day?
To analyze whether the platform contains biased political leaning content on each day, I organized the data by the day the video was published. The number of left, right, and center videos by the time they are published is shown in the following graph. By considering the leaning as a fixed effect and the date gets published as a random effect, a mixed-effect model analysis shows that the amount of left, right and center videos are significantly different over the collected time period (p < 0.01). On average for each day, center videos share 1% of the total videos, while left and right videos share 18.9% and 31.4% of the total videos, respectively.
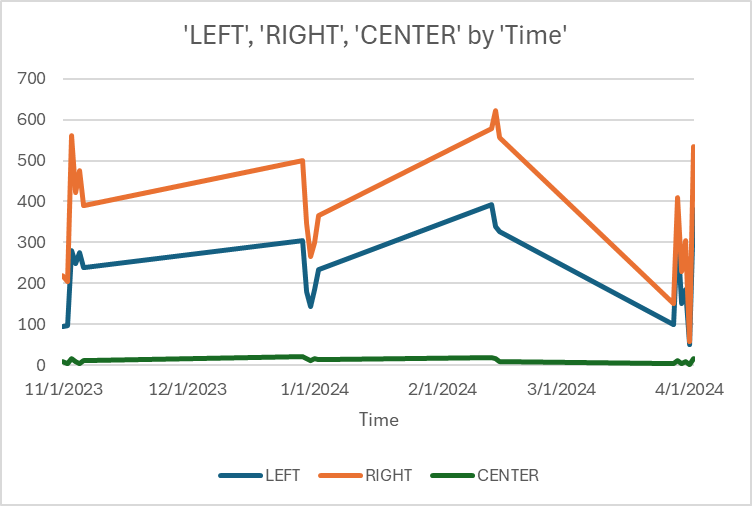
[The number of left, right, and center videos by the time they are published. No data was collected between 11/8-12/27, 1/3-2/13, and 2/16-3/28. The image uses a single line to connect these gaps; the number of videos on the boundary dates has been excluded from the graph for better visualization.]
RQ2: Which engagement factor influence the possibility of a video being viewed?
The engagement is determined by the number of times the video was liked, shared, the total number of comments, the number of the author’s followers, and comments’ engagement, which is defined as the number of likes and replies to all comments. For video-type content, a Spearman’s rank correlation test shows play counts are significantly correlated with the number of likes (p<0.0001), comments (p<0.0001), shares (p<0.0001), comments’ engagement (p<0.0001), and the number of the author’s followers (p<0.0001).
For other types of content, a Spearman’s rank correlation test shows play counts are significantly correlated with the number of likes (p<0.0001), comments (p<0.0001), shares (p<0.0001), and the number of the author’s followers (p≈0.0007). However, comments’ engagement is not significantly correlated with the play counts (p≈0.0586).
For image-type content, a Spearman’s rank correlation test shows play counts are significantly correlated with the number of likes (p<0.0001), comments (p<0.0001), shares (p<0.0001), comments’ engagement (p<0.0001), and the number of the author’s followers (p<0.0001).
RQ3: Does TikTok community react to different political leaning content equally?
To determine whether the TikTok community reacts to different political leaning content equally, the view count, like count, videos’ lifetime of a video has been considered.
A Kruskal-Wallis Test shows a significant difference in the like count between left, right, and center videos (p<0.0001). Center videos (Median=87, M=1921) received more likes on average than the left (Median=92, M=1348), while right videos (Median=98, M=1997) received more likes than the center videos. A log transformation was applied to the like count to better visualize the data. The graph below shows the log of the like count for left, right, and center videos:
vspolitical.jpg)
[The log of the like count for left, right, and center videos.]
A Kruskal-Wallis Test shows a significant difference in the view count between left, right, and center videos (p<0.0001). Center videos (Median=1162, M=20468) received more views on average than the left (Median=1161, M=20216), while right videos (Median=1196, M=24581) received more views than the center videos. A log transformation was applied to the view count to better visualize the data. The graph below shows the log of the view count for left, right, and center videos:
vspolitical.jpg)
[The log of the view count for left, right, and center videos.]
A Kruskal-Wallis Test shows a significant difference in the videos’ lifetime between left, right, and center videos (p$\approx$0.0026). Center videos (Median=0.5, M=1.3) have a shorter lifetime on average than the left (Median=0.5, M=1.4), while right videos (Median=0.5, M=1.4) have a longer lifetime than the center videos. A log transformation was applied to the videos’ lifetime to better visualize the data. The graph below shows the log of the videos’ lifetime for left, right, and center videos:
vspolitical.jpg)
[The log of the videos’ lifetime for left, right, and center videos.]
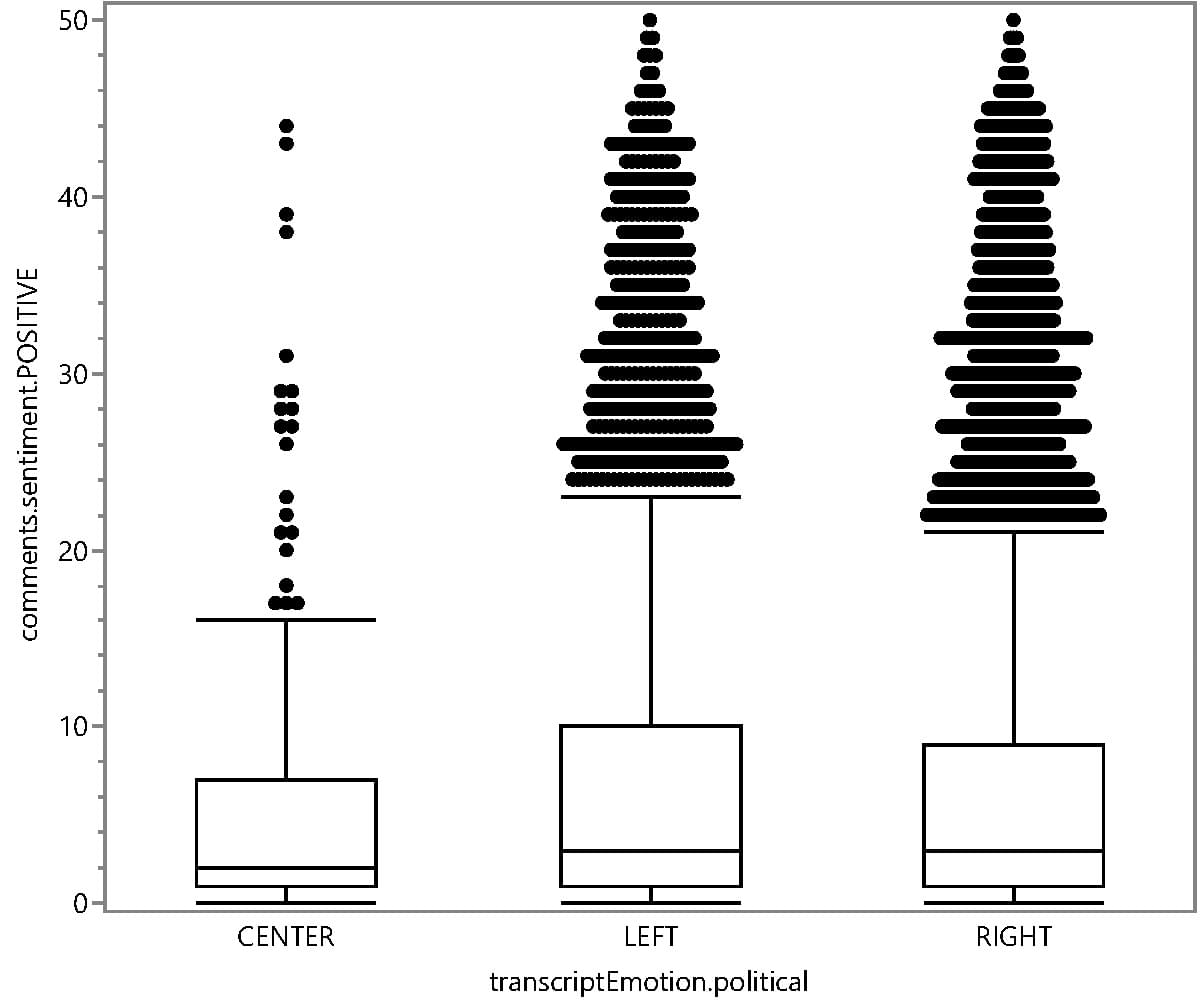
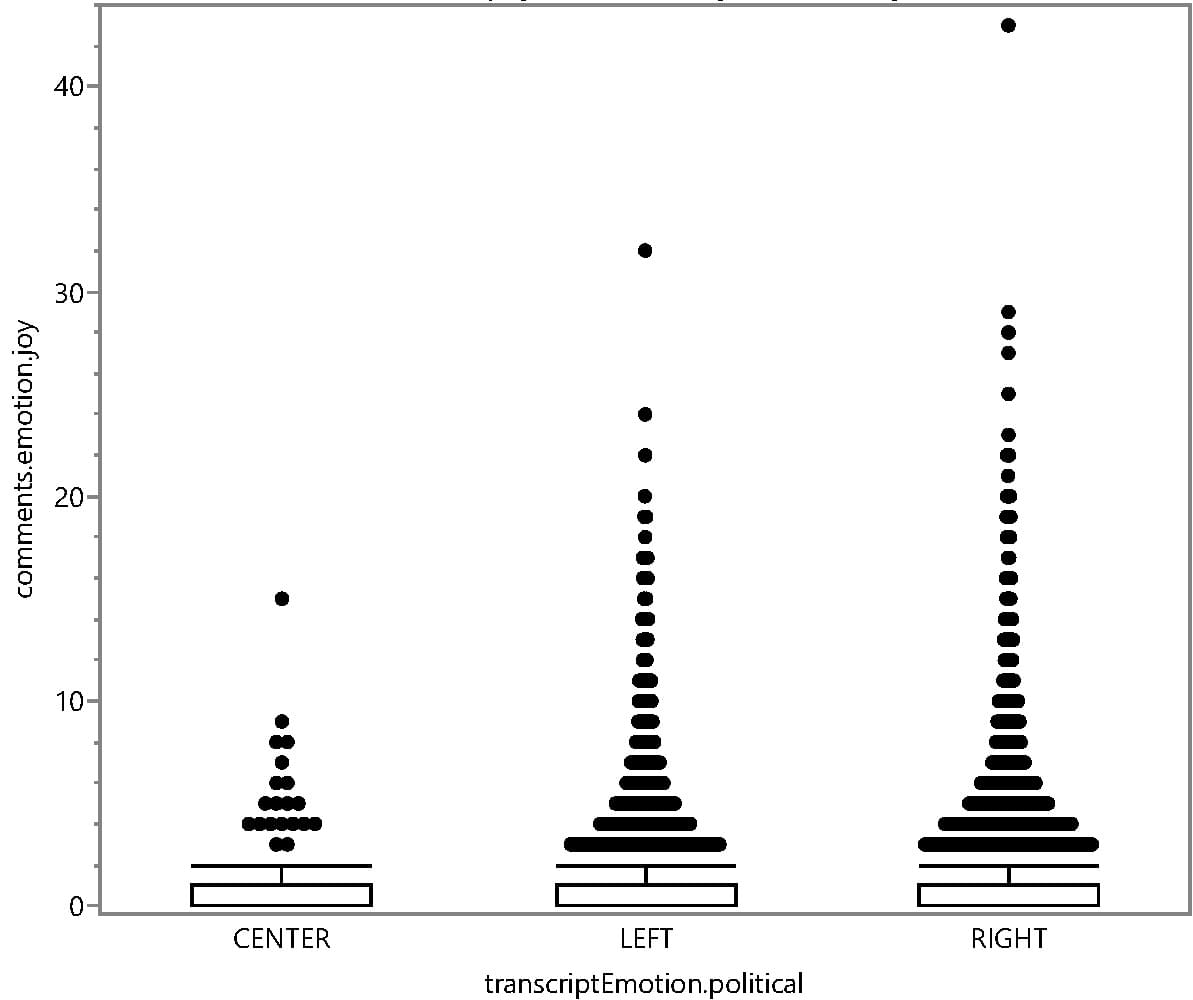
To evaluate whether the TikTok community reacts equally to content with different political leanings, it is important to check if different political leaning content can receive a similiar amount of comments. A Kruskal-Wallis Test was conducted to compare the distribution of comment types across videos categorized as left, right, or center: positive sentiment (p = 0.0003), anger (p = 0.0305), disgust (p = 0.0162), fear (p = 0.0059), joy (p = 0.0001), and neutral emotion (p = 0.0081). However, no significant differences were observed for negative sentiment (p = 0.088), sadness (p = 0.95), or surprise (p = 0.4403). These findings highlight varying community responses depending on the emotional tone and sentiment of the content.
Since a statistical test on multiple factors is run, a bonferroni correction has been applied to the p-value, such that a valid threshould p-value is 0.05/9=0.0056. The results show that the amount of positive sentiment comments, joy emotion comments are significantly different between left, right, and center videos. The amount of negative sentiment comments, anger emotion comments, disgust emotion comments, fear emotion comments, sadness emotion comments, surprise emotion comments, and neutral emotion comments are not significantly different between left, right, and center videos.
On average, center videos received 5.5 positive sentiment comments, left videos received 7.4 positive sentiment comments, and right videos received 7.3 positive sentiment comments, as shown in the graph below:
On average, center videos received 0.76 joy emotion comments, left videos received 1.1 joy emotion comments, and right videos received 1.0 joy emotion comments, as shown in the graph below:
RQ4: Whether different political leaning videos on TitkTok have different lexical diversity?
Videos on the left parties might be more radical, such that they may use less diverse words. To test this hypothesis, the lexical diversity of the video transcripts was calculated using the MATTR strategy. A Kruskal-Wallis Test shows a significant difference in the lexical diversity between left, right, and center videos (p<0.0001). Center videos (Median=0.89, M=0.88) have a higher lexical diversity on average than the left (Median=0.87, M=0.86), while right videos (Median=0.86, M=0.84) have a lower lexical diversity than the center videos. The graph below shows the lexical diversity for left, right, and center videos:
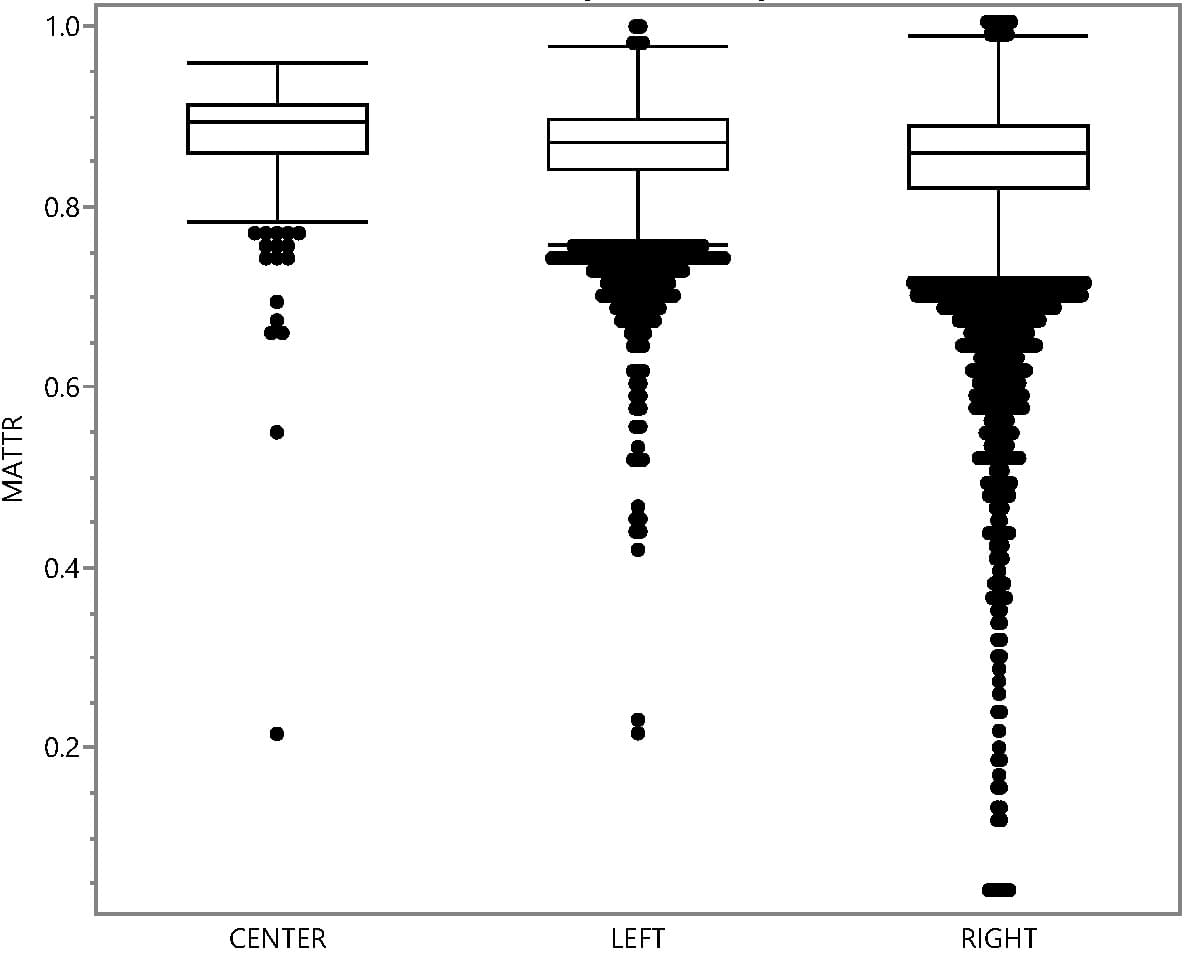
[The lexical diversity for left, right, and center videos.]
RQ5: To what extent do videos with different political leanings cover the same categories?
TikTok official provided a list of categories that the videos can be classified into and a list of keywords it automatically extracted for each video.
Among the videos collected, LEFT-leaning videos covered 87 unique categories (89.7% of all unique categories) and 17,791 unique keywords (9.7% of all unique keywords). RIGHT-leaning videos covered 89 unique categories (91.8% of all unique categories) and 24,876 unique keywords (13.5% of all unique keywords). CENTER-leaning videos were the least diverse, covering 39 unique categories (40.2% of all unique categories) and 1,452 unique keywords (0.8% of all unique keywords). Overall, the dataset spans 97 unique categories and 184,393 unique keywords.
The top 10 categories and keywords for each political leaning are shown in the following tables:
| Categories for LEFT-leaning videos | Categories for RIGHT-leaning videos | Categories for CENTER-leaning videos | All categories |
|---|---|---|---|
| Society, 5458 | Society, 7906 | Society, 334 | Society, 66292 |
| Social Issues, 2294 | Social Issues, 3209 | Social Issues, 103 | Social Issues, 28091 |
| Social News, 430 | Performance, 946 | Social News, 64 | Lip-sync, 9148 |
| Entertainment, 245 | Lip-sync, 818 | Entertainment, 6 | Performance, 8507 |
| Culture & Education & Technology, 226 | Entertainment, 729 | Culture & Education & Technology, 5 | Entertainment, 7827 |
| Lifestyle, 187 | Social News, 686 | Sports, 5 | Auto & Vehicle, 6034 |
| Sport & Outdoor, 186 | Comedy, 533 | Sport & Outdoor, 5 | Lifestyle, 4955 |
| Education, 155 | Entertainment Culture, 369 | Education, 4 | Social News, 4917 |
| Entertainment Culture, 152 | Auto & Vehicle, 280 | Extreme Sports, 4 | Sport & Outdoor, 4646 |
| Daily Life, 142 | Sport & Outdoor, 258 | Auto & Vehicle, 4 | Comedy, 3900 |
| Keywords for LEFT-leaning videos | Keywords for RIGHT-leaning videos | Keywords for CENTER-leaning videos | All keywords |
|---|---|---|---|
| fyp, 1271 | fyp, 2744 | fyp, 86 | fyp, 33003 |
| trump, 1128 | trump, 2182 | trump, 52 | trump, 22393 |
| politics, 691 | biden, 1177 | news, 47 | trump2024, 15001 |
| biden, 635 | trump2024, 1131 | biden, 44 | biden, 11574 |
| republican, 557 | politics, 985 | foryou, 42 | foryou, 11102 |
| trump2024, 476 | foryou, 958 | usa, 41 | maga, 9240 |
| democrat, 435 | republican, 922 | politics, 39 | fypシ, 8994 |
| foryou, 434 | maga, 752 | republican, 34 | foryoupage, 8971 |
| duet, 425 | duet, 736 | democrat, 31 | viral, 8942 |
| maga, 397 | donaldtrump, 707 | foryoupage, 27 | duet, 8722 |
Discussion
The data analysis shows that the platform contains biased political leaning content, with right-leaning videos being the most prevalent. It is surprising to see that left and right videos have a similar amount of positive sentiment comments and joy emotion comments, both higher than center videos. The data also shows that center videos have a higher lexical diversity than left and right videos.
Most of the keyword analysis remains the same as the original work attached to the dataset, which comes from an extraction from the hashtags inside the description. Unsurprisingly, “trump,” “biden,” and “fyp” are the most common keywords for all political leanings. It is interesting to see that both left and center videos have “democrat” as a top-10 keyword, while right videos do not. This could suggest that right parties are more narcissistic and arrogant. The category analysis shows that the videos are mostly about society, social issues, and social news.
Limitation
Limited by the scope of this project and the fact that the original data were obtained through a simple search using the TikTok research API, any analysis can only reflect the data pre-collected, meaning it represents the video demographics already published by all uploaders on the platform rather than an issue with the platform itself. It is also important to note that while the platform can recommend videos to users, users may also artificially inflate view counts, and data analysis cannot distinguish between these two scenarios. A comparison between the initial data collection and the current collection could potentially indicate the platform’s favor or bias. However, without interacting with the platform in real time and simulating the process to get more data, it is impossible to determine the platform’s bias or reveal any problem on it.
The video selection is not comprehensively random. From the data, it is evident that the data comes from a certain range of dates. This might introduce bias into the data analysis. The politicalBiasBERT model used in this project is not well-known for its accuracy and reliability on TikTok’s transcript and comments data. Further study is necessary to determine whether it is reliable for this dataset.
Conclusion
The data analysis provides insights into the political content on TikTok and how the platform’s algorithms may influence the spread of political content. Right videos get more engagement than left videos and then center videos, while center videos have a higher lexical diversity than left and right videos. The TikTok community reacts differently to content with different political leanings, with varying levels of positive sentiment and joy emotion comments. The analysis also shows platform’s bias in the amount of left, right, and center videos. The data analysis provides a foundation for further research on the political content on TikTok and how the platform’s algorithms may influence the spread of political content.